What is DataPortal?
Basic information
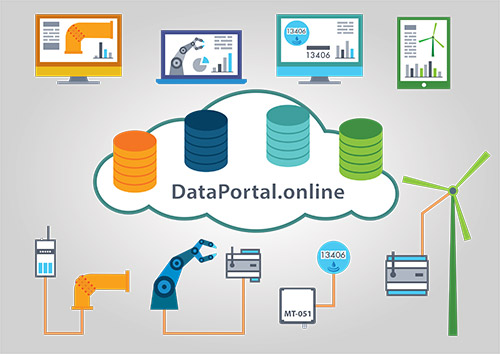
DataPortal is a visualization system designed as a remote service that operates in a secure cloud computing environment.
To use DataPortal—that is, to create and view screens with animated graphics—neither additional external software nor specialized hardware serving as a data server is required.
Processes carried out in the DataPortal system, such as:
- collecting data from devices,
- processing and analyzing it,
- and making prepared screens available to users,
are under constant system control.
DataPortal is a stable and secure environment for small, medium and large systems.
To start working in the DataPortal system, it is necessary to have an Inventia telemetry module along with its serial number and IMEI number. One module allows the creation of one account, while many modules can be assigned to each account, creating extensive telemetry systems with visualization available on any device with a web browser.
Purpose of the system
The DataPortal system is used for:
- supervision of facilities
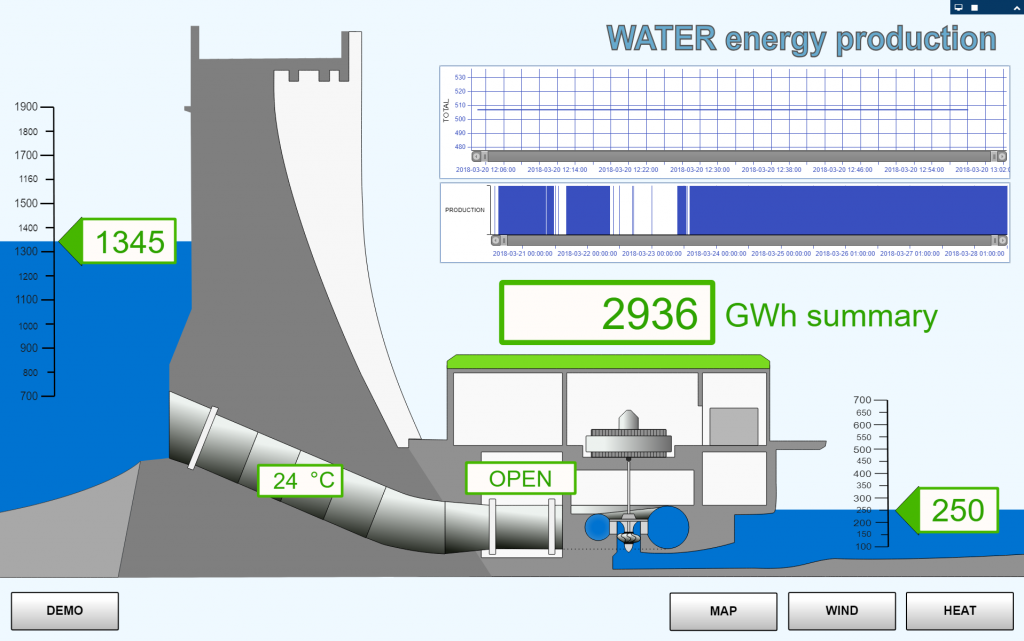
- visualization of data from telemetry modules on animated synoptic screens
- converting input data into information presented in a clear and easy-to-interpret way
- archiving selected data
- reporting and analysis of collected data
- alerting and notifying about critical states, e.g., exceeding predefined alarm thresholds
- configuring selected telemetry modules
- buffering data and transferring it to other systems
- accessing information in a secure cloud
Example applications
- control and monitoring of booster stations and sewage pumping stations
- monitoring the generation of electricity in wind farms and photovoltaic installations
- predictive monitoring of electrical switchboards along with an SMS and email notification system
- control and monitoring of the operation of generators in emergency power systems
- monitoring parameters of cathodic protection stations
- graphical reports of water consumption based on remote reading of water meters
- monitoring levels of surface and groundwater
- monitoring leaks in municipal heating system installations
- distributing data on brown coal extraction from mines scattered around the world to a client server
- a system for monitoring liquid parameters along with notifications about exceeding permissible norms
Benefits of the cloud solution
- presentation of data in an individual graphic form defined by the user
- multiple concurrent users with different permissions within one account
- viewing on various types of devices through web browsers or dedicated applications
- automatic scalability as the system expands
- cost savings associated with building and maintaining your own server infrastructure
- alerting with notifications via email and/or SMS
- visualization operating non-stop 24/7, even when the operator logs out
- monitoring and control through animated screens
- billing for the usage of system components